Group Analysis using Break Conditions
Overview
There are many types of analysis in which grouping is desired. A sample would be a sales report broken down by region and account managers. Groups are used to define "control breaks" for reporting analysis. Control breaks are used to group subsets of data within a list.

Data Retrieval
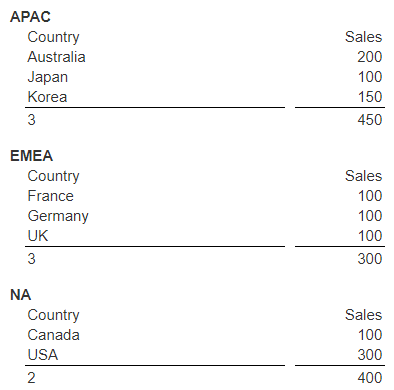
Consider this set of simple data.
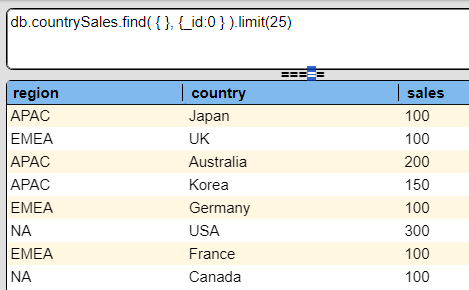
The first step is to retrieve the data in the desired order.
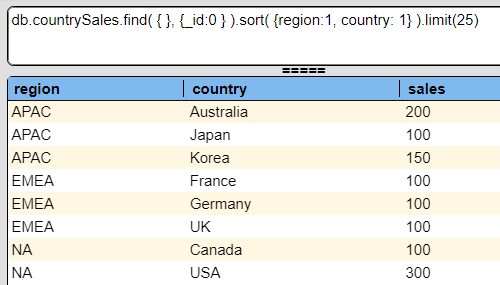
In this example a Data Source is saved as “Sales by region and country”.
Template Structure
Data Retrieval
Open the Template Designer.
Access the properties by clicking

Click the highlighted icon to access the most recent data sources.

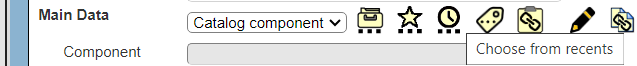
Select the desired data source.

Click OK.
The reference is filled in.

Click OK to close the properties dialog.
Group Definition
In the left hand side right click any line in group 1.1 for the popup menu.

Choose the highlighted option.

In the group properties dialog fill in the break expression. Complex expressions can be specified, but in this case we are grouping by the region field.

Click OK to close the properties dialog.
Other Template Cells
Add another group header line by clicking

The first group header line will show the region and the second is for the headings for the country sales information.

First Pass Results
Run this by clicking

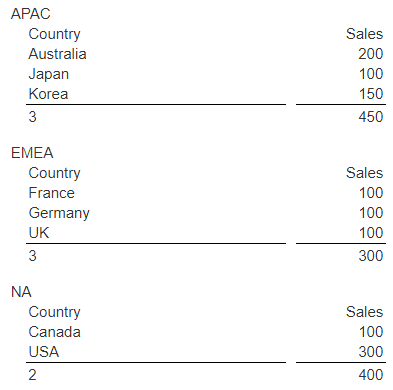
At this point the output is shown below.

Adding Counts and Summations
Switch back to the Design tab.

Select the country cell on the body line.

Right click and choose the option highlighted below.

Select the sales cell on the body line.

Right click and choose the option highlighted below.

Select the group summary line.

Add a spacer line by clicking

Run this by clicking
The updated output is shown below.
Switch back to the Design tab.
Select the region cell.
Click the bold button.

The cell result is shown below.

Run this by clicking
The updated output is shown below.
Additional formatting can be done on the sales numbers and further cells defined based on your data.
Save this template by clicking.

Navigate to the desired catalog folder.
Enter the name “Sales by region and country”. (This template will be used as the starting point for the percent of total example).
Click OK.
Multiple Group Breaks
Standard Analysis Result
Consider a sales data query and its answer set shown below.
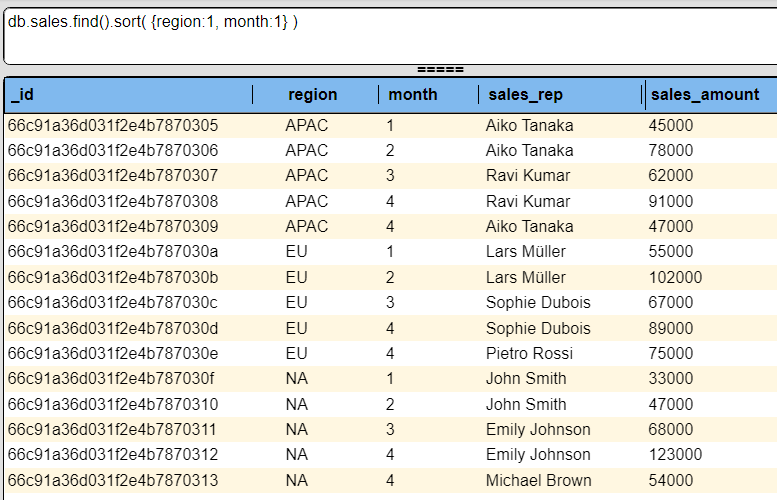
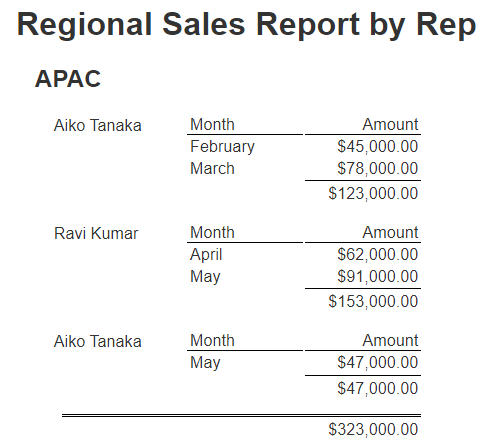
Our sales analysis goal is to get total sales for each sales representative, the region, and overall. Here is the output for the first region.
The general template is pictured below.
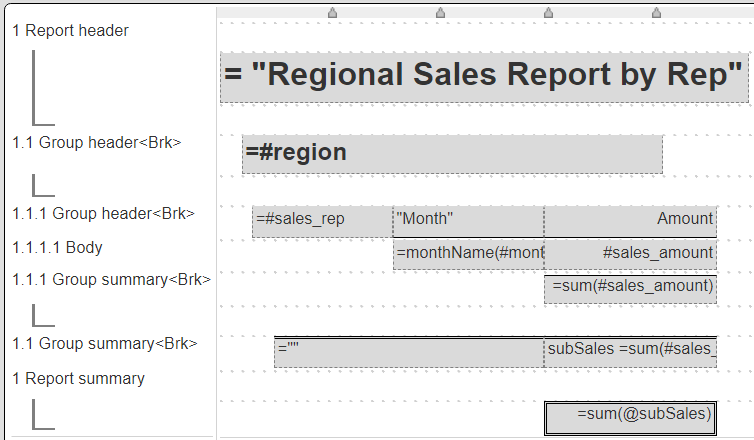
Note that there are 2 groups being used. The first group is used for regional values and the second one is used to contain sales representative values. On the far right of the Template Designer choose the dropdown option shown to see the data retrieval and break information.

For this analysis there is a summation for each sales representative on the group 1.1.1 summary and a higher level summation for the region on the group 1.1 summary. The report summary has a summation as well to accumulate the total sales.
Below is a side by side picture of the results.
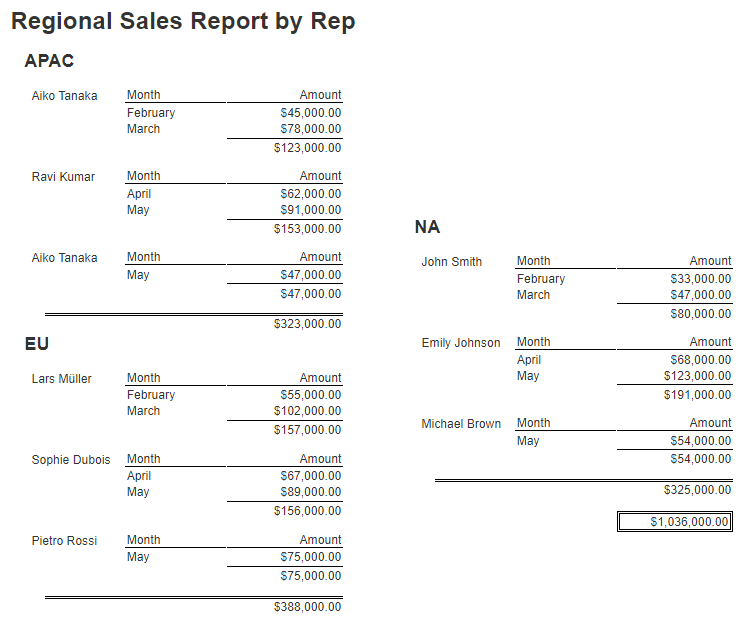
This example is in the catalog as “example/Custom cells/Sales report with region and rep groupings”.
Analysis with Percent of Total across the Groups
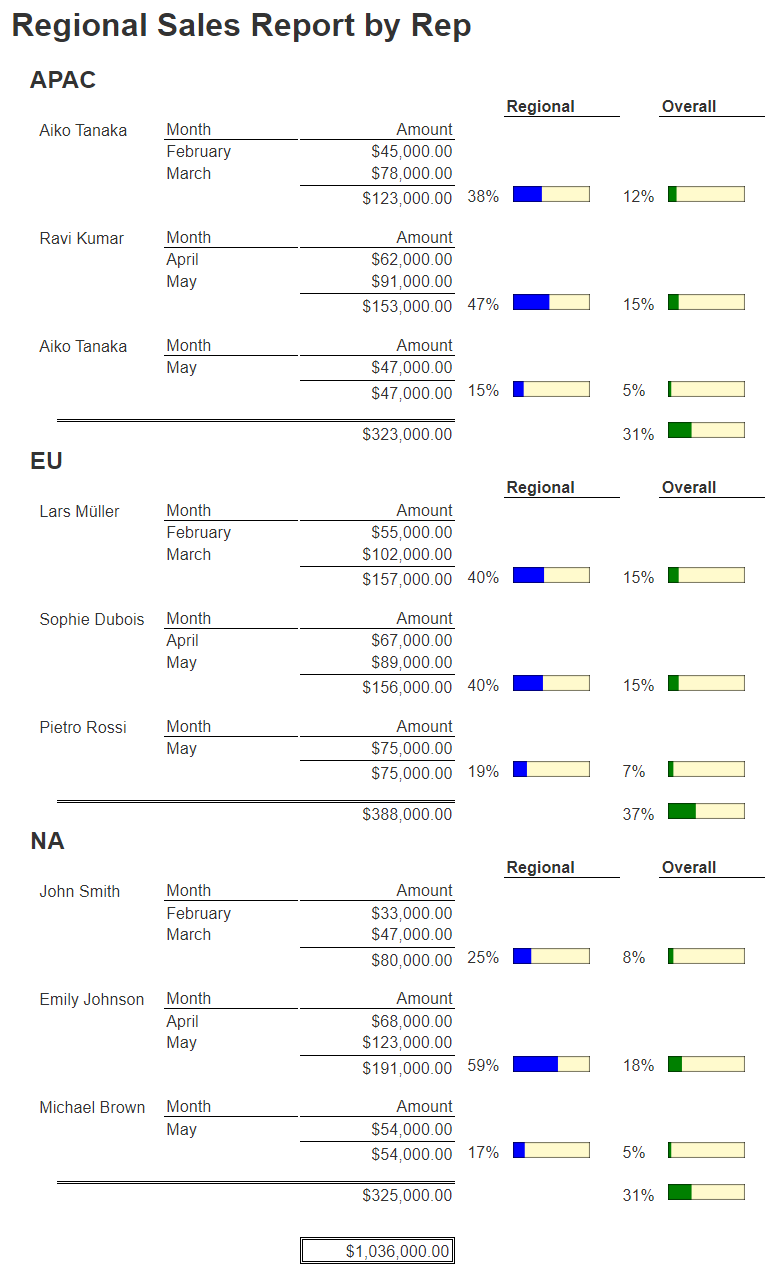
To enhance the analysis above we can add the following information:
- For each region, what percentage of sales did each sales representative contribute?
- These are the blue line bars.
- Overall, what percentage of sales did each region contribute?
- These are the green line bars at the regional summary level.
- Overall, what percentage of sales did each sales representative contribute?
- These are the green line bars for each sales representative summary level.
The analysis output is shown below.
The template for this can be found at “example/Custom cells/Sales report with region and rep groupings and POTs”. The general template grid cells are shown below.
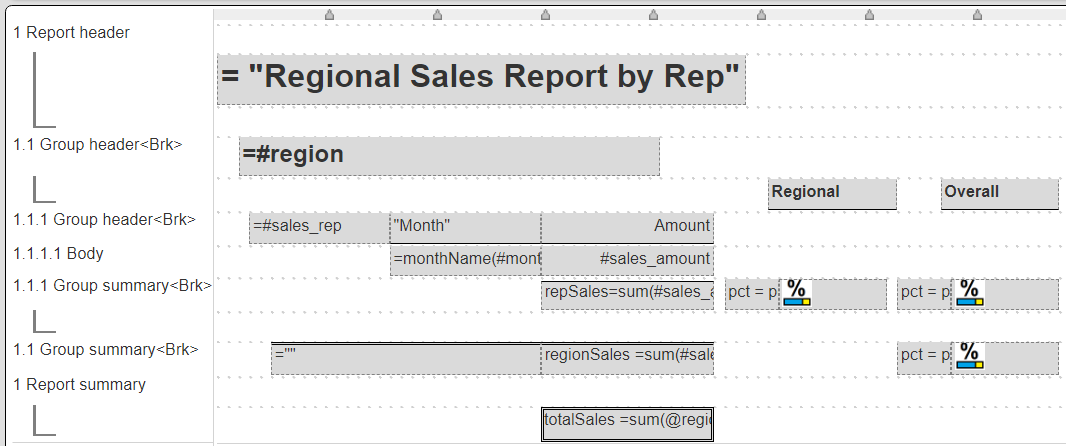
The formulas below the “Amount” heading each perform a summation of sales using the following series of formulas:
repSales = sum(#sales_amount)
regionSales = sum(#sales_amount)
totalSales = sum(@regionSales)
The 1.1.1 group summary cells are, from left to right,
= pot( @repSales, @regionSales)
= pot(@repSales, @regionSales)  ← The 1st percentage graphic custom cell
= pot( @repSales, @totalSales)
= pot(@repSales, @totalSales)  ← The 2nd percentage graphic custom cell
The 1.1. Group summary cells are, from left to right,
= pot( @regionSales, @totalSales)
= pot( @regionSales, @totalSales)  ← The bottom right percentage graphic custom cell